Traffic Stop Racial and Gender Bias in Texas
Python, Pandas, and Matplotlib Project. Analyzing bias in Texas when pulled over for similar crimes.

Project Specifications
This was the midterm project for a class on Computational Data Science taught by Dr. Jin Tao, a Data Science Guru and excellent researcher at Texas A&M.
As someone who has personally been affected by both systemic and explicit racism, I chose this project with a real interest in the finds. The goal of this project was to identify biases in policing during traffic stops during 2010-2016 in TEXAS.
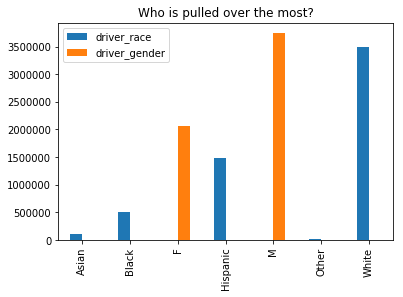
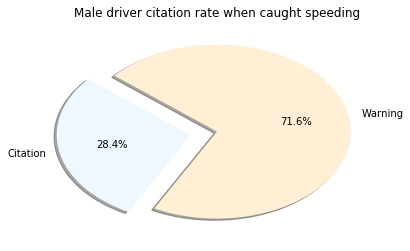
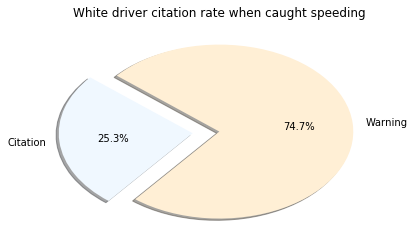
The question was…do different groups of people receive citations rather than warnings in a disproportionate manner for the same type of traffic stop.
Process
First was simply opening the data. The only way was to use Pandas’ read_csv function into Python. Here is a snippet of the data that was chosen.
| id | state | stop_date | stop_time | location_raw | county_name | county_fips | fine_grained_location | police_department | driver_gender | driver_age_raw | driver_age | driver_race_raw | driver_race | violation_raw | violation | search_conducted | search_type_raw | search_type | contraband_found | stop_outcome | is_arrested | lat | lon | officer_id | driver_race_original | |
|---|---|---|---|---|---|---|---|---|---|---|---|---|---|---|---|---|---|---|---|---|---|---|---|---|---|---|
| 0 | TX-2010-0000002 | TX | 1/1/2010 | 0:00 | Guadalupe | Guadalupe County | 48187 | 622 | F | Asian | Asian | Speeding Over Limit (#) | Speeding | FALSE | FALSE | Warning | 29.62287 | -97.7787 | 11524 | Asian | ||||||
| 1 | TX-2010-0000003 | TX | 1/1/2010 | 0:00 | Fannin | Fannin County | 48147 | 668 | F | White | White | Speeding Over Limit (#) | Speeding | FALSE | FALSE | Warning | 33.60318 | -96.1502 | 12274 | White | ||||||
| 2 | TX-2010-0000004 | TX | 1/1/2010 | 0:00 | Coryell | Coryell County | 48099 | 560 | M | Black | Black | Fail to Maintain Financial Responsibility (#) | Paperwork | FALSE | FALSE | Citation | 31.1216 | -97.8354 | 12365 | Black |
The first thing was to get rid of null data. I should have detailed how many null points there was, however from visual inspection there was not that many. Really the main null cells, were a few where the race of the driver was not recorded. Next I pull just the rows that contained Race, and violations that were similar… i.e. included the word “speeding”. Additionally, I pull the “registered” gender Now I also crucially grab the column that shows the “Outcome” of the traffic stop. It basically shows whether the outcome was a citation or a ticket.
| driver_gender | violation | stop_outcome | driver_race_original |
|---|---|---|---|
| M | Speeding | Warning | Asian |
| M | Speeding | Warning | White |
Armed, pun-intended with this information, I can do a lot of analysis. I used MatplotLib to generate charts and graphs.
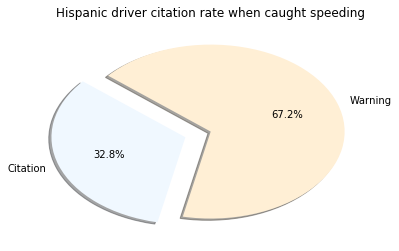
Conclusion
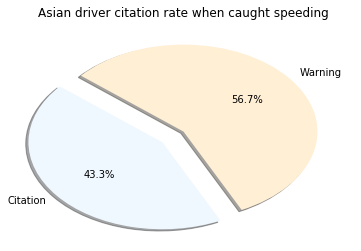
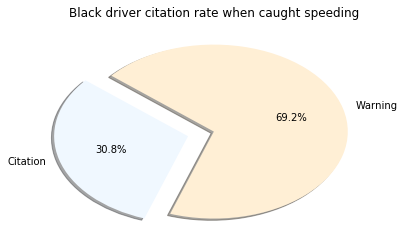
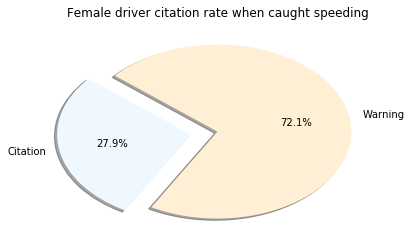
I was surprised to see the highest percentage belonged to those classified of Asian descent. However, it’s important to note very few Asian drivers are pulled over. Another layer to this investigation missing was to see the number of traffic stops to the actual population of that group. This may have shown bias from a different angle. What is clear is that Males are pulled over in much higher amounts the Females. I cannot accurately speculate on the reasoning behind this, but there are plenty of studies about it.